A <-read.csv(file=”Week5.csv”)
table(A$school)
summary(lm(data=A,math ~ grades))
————————————————————————————————————–
A <-read.csv(file=”Week5.csv”)
table(A$grades)
reg1 <- lm(data=A,math ~ grades)
attach(A)
plot(math~grades)
plot(grades,math)
reg2<- lm(math ~ county)
summary(reg2)
model1 <- lm( math ~ lunch+ income+read)
summary(model1)
B <- A [1:420 , c(8,11,13,14)]
head(B,10)
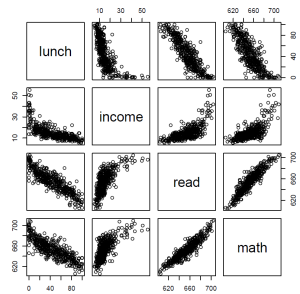
plot(B)
model1 #再SHOW一次結果
math_lunch_read <- lm( math ~ lunch+read)
income_lunch_read <- lm( income ~ lunch+read)
lm( math_lunch_read $residuals ~income_lunch_read$residuals) #預測值挖掉
math_lunch_income <- lm( math ~ lunch+income)
read_lunch_income <- lm( read ~ lunch+income)
lm( math_lunch_income$residuals ~read_lunch_income$residuals) #預測值挖掉
library(olsrr) #先安裝olsrr套件
ols_coll_diag(model1)
summary(model1) #顯示結果為lunch不顯著 #income及read顯著
library(stargazer)
spec1 <- lm( math ~ lunch+read)
spec2 <- lm( income ~ lunch+read)
spec3 <- lm( math ~ lunch+income)
spec4 <- lm( read ~ lunch+income)
stargazer(spec1,spec2,spec3,spec4,
type = “html”,
out = “regression.html”,
title = “My Regression models”) #再到變更現行目錄的位置打開html檔案
windows()
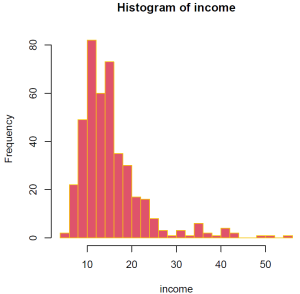
hist(income,breaks=20,col=10,border=15) #直方圖


